TV usage declined 6.4% versus January 2024, new data from Nielsen show. However, the nation’s dominant audience measurement company notes that the decrease “is more a testament to how massive viewing was” in a month that featured key NFL playoff match-ups.
In fact, February had higher overall usage levels than the prior two Februarys, making year-over-year trends positive for television, Nielsen notes.
Just how massive was January 2024 TV consumption? The 6.4% decline compares to a 5.7% decline in 2023 and a 5.1% decline in 2022.
And, Nielsen says, the 6.4% drop was countered somewhat by the “extraordinary high” viewing levels of Super Bowl LVIII on Feb. 11. This date now holds the record for the most total viewing of any day since the start of “The Gauge” by Nielsen in May 2021, which offers a “total TV and streaming snapshot” for marketers and media executives.
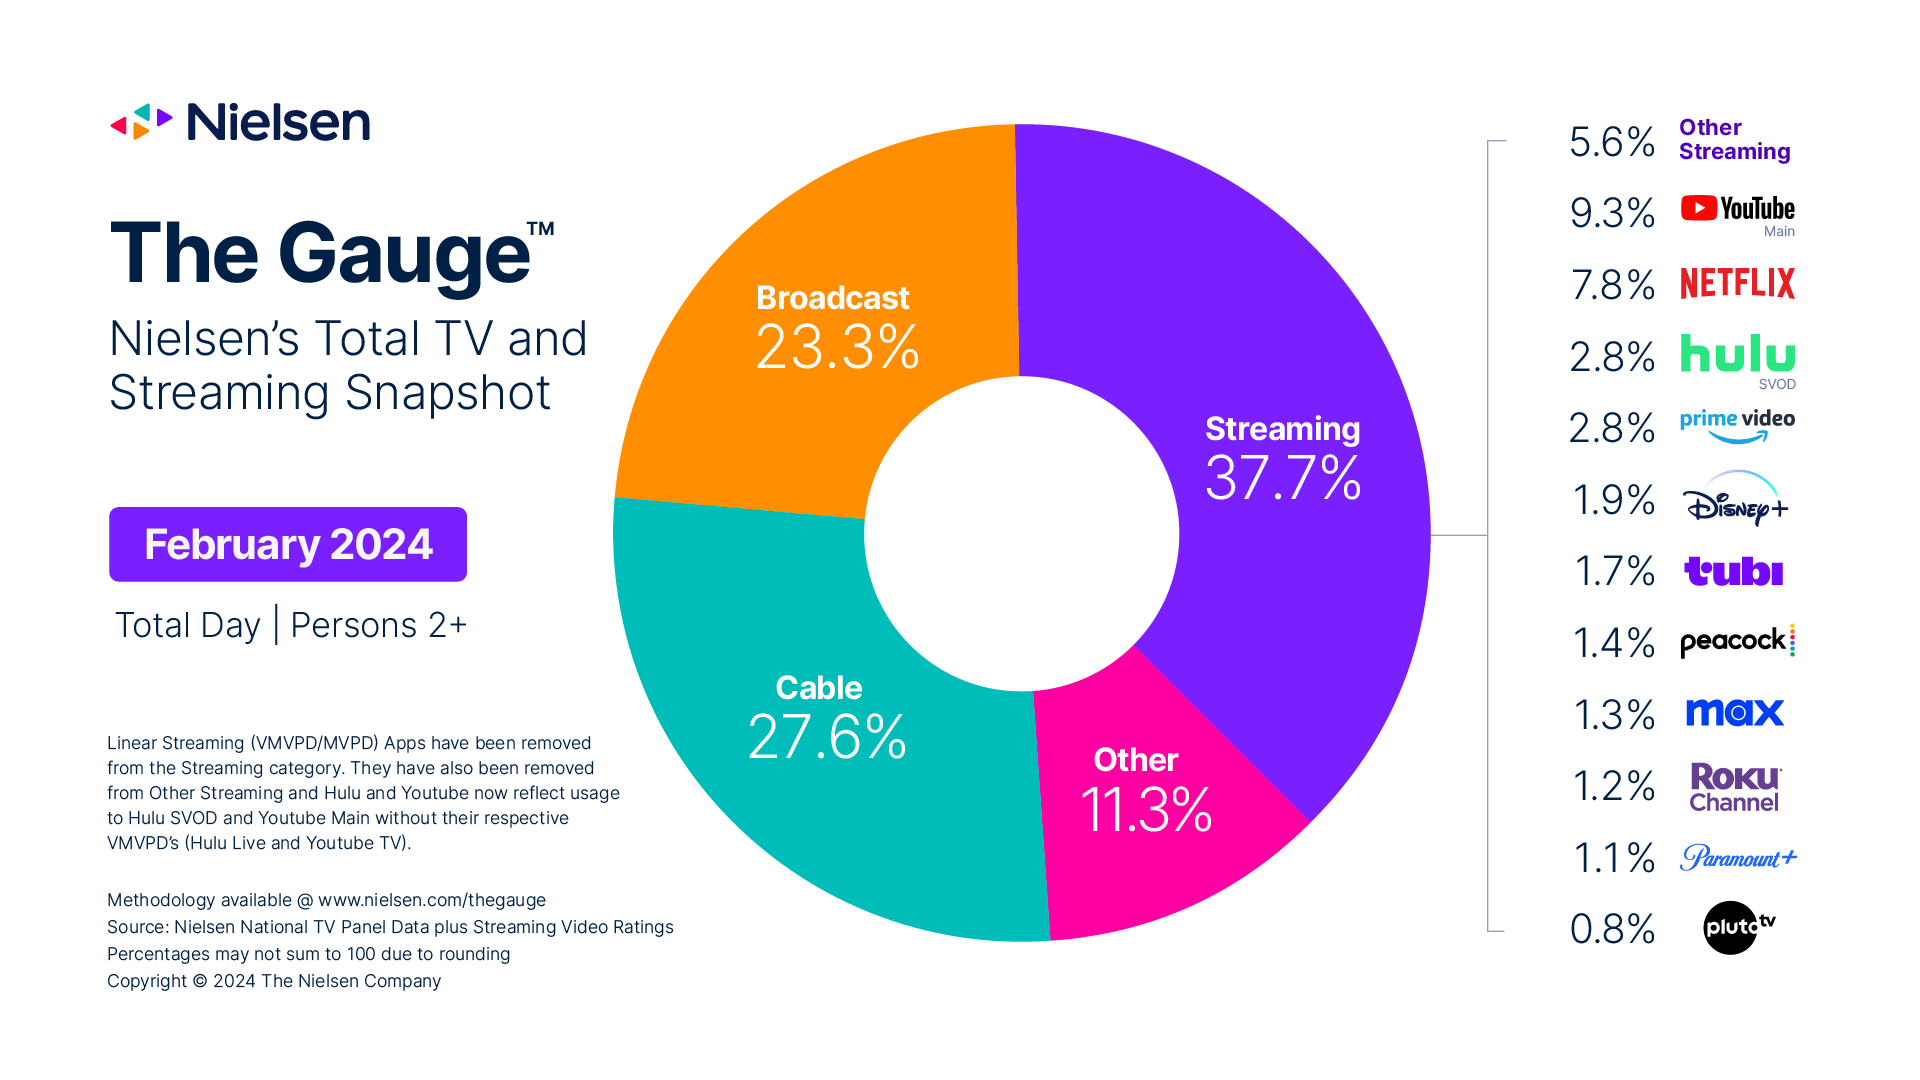
Traditional TV (Broadcast + Cable) viewing accounted for 50.9% of overall TV usage, down from 54.1% in the year-ago period. This was its smallest combined share since August 2023 and likely reflects soft original programming, post-holiday, and lingering effects of the SAG-AFTRA and WGA East/WGA West work stoppages of last year.
Broadcast viewing comprised 23.3% of overall TV usage; cable viewing was 27.6% of overall TV consumption.
It is notable that cable exhibited its smallest share to date, Nielsen reports.
Comparatively, streaming accounted for its largest share of TV since August 2023, with 37.7% of TV usage.